REAL TIME NEWS
Loading...
Title USOUSD H4 | Bullish bounce off key support Type Bullish bouncePreference The price is falling towards the pivot at 61.99, an overlap support. A bounce from this level could lead the price toward the 1st resistance level at 63.86, a pullback resistance. Altern...
Title USOUSD H4 | Bullish bounce off key support Type Bullish bouncePreference The price is falling towards the pivot at 61.99, an overlap support. A
SP500 LDN TRADING UPDATE 13/2/26WEEKLY & DAILY LEVELS***QUOTING ES1! FOR CASH US500 EQUIVALENT LEVELS, SUBTRACT POINT DIFFERENCE***WEEKLY BULL BEAR ZONE 6900/6890WEEKLY RANGE RES 7059 SUP 6847FEB OPEX STRADDLE 6726/7154MAR QOPEX STRADDLE 6466/7203DEC 2026 OPEX ...
SP500 LDN TRADING UPDATE 13/2/26WEEKLY & DAILY LEVELS***QUOTING ES1! FOR CASH US500 EQUIVALENT LEVELS, SUBTRACT POINT DIFFERENCE***WEEKLY BULL BEA
Daily Market Outlook, February 13, 2026 Patrick Munnelly, Partner: Market Strategy, Tickmill GroupMunnelly’s Macro Minute…Markets across a broad spectrum of asset classes faced sharp declines as concerns surrounding tech sector earnings and commodity weakness weigh...
Daily Market Outlook, February 13, 2026 Patrick Munnelly, Partner: Market Strategy, Tickmill GroupMunnelly’s Macro Minute…Markets across a broad spect
As central banks globally attempt to reassure the markets that only a minor recession may be necessary to rein in inflation, anxiety about a significant economic downturn appears to be escalating. The recent situation in the UK has underscored that any unfinanced g...
As central banks globally attempt to reassure the markets that only a minor recession may be necessary to rein in inflation, anxiety about a significa
FTSE 100 FINISH LINE 13/2/26 On Friday, Britain's FTSE indexes remained subdued, mirroring a cautious global market sentiment during a week dominated by concerns over AI-driven disruptions. Defence stocks, however, experienced gains as investors anticipated st...
FTSE 100 FINISH LINE 13/2/26 On Friday, Britain's FTSE indexes remained subdued, mirroring a cautious global market sentiment during a week domin
Title GBPJPY H4 | Falling towards overlap supportType Bullish bounce Preference The price is falling towards the pivot at 207.25, an overlap support that aligns with the 50% Fibonacci retracement. A bounce at this level could lead the price toward the 1st resistanc...
Title GBPJPY H4 | Falling towards overlap supportType Bullish bounce Preference The price is falling towards the pivot at 207.25, an overlap support t
Title USDCAD H1 | Bullish bounce off 61.8% Fib support Type Bullish bounce Preference The price is falling towards the pivot at 1.3590, which is a pullback support that aligns with the 61.8% Fibonacci retracement. A bounce from this level could lead the price towa...
Title USDCAD H1 | Bullish bounce off 61.8% Fib support Type Bullish bounce Preference The price is falling towards the pivot at 1.3590, which is a pu
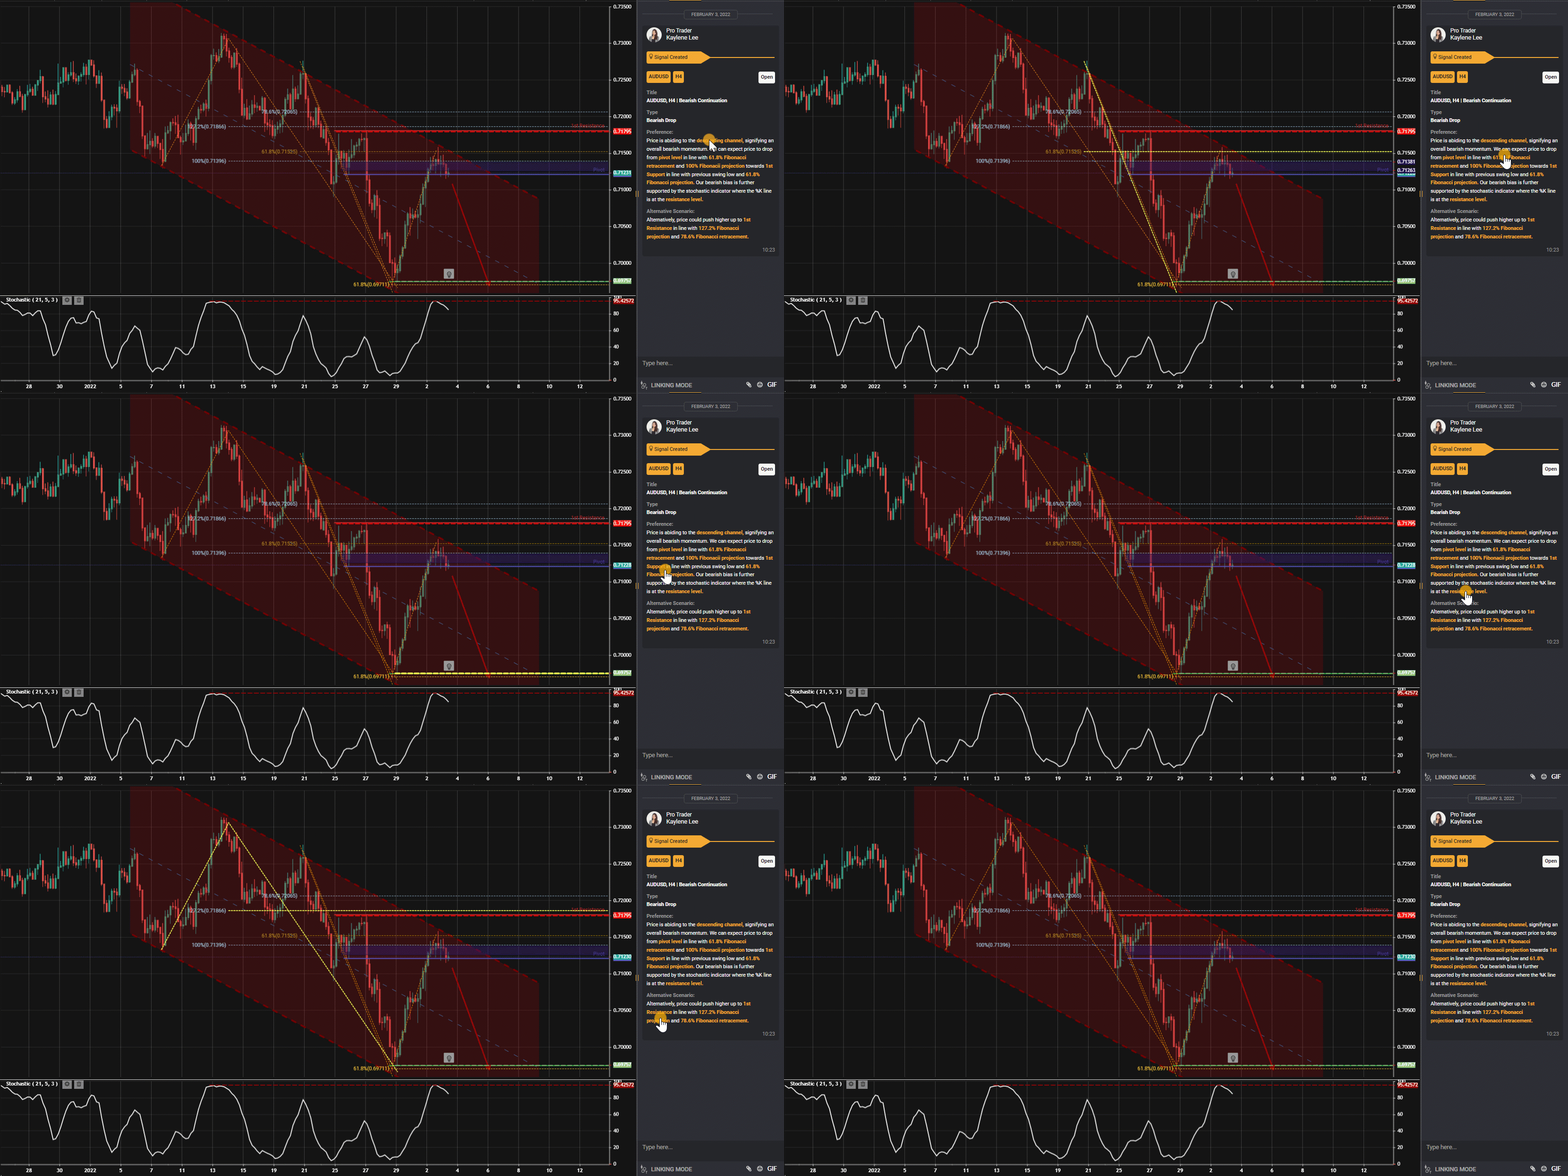
Title AUDUSD H1 | Bearish reversal off pullback resistance Type Bearish reversal Preference The price is rising towards the pivot at 0.7107, a pullback resistance that is slightly below the 50% Fibonacci retracement. A reversal from this level could lead the price ...
Title AUDUSD H1 | Bearish reversal off pullback resistance Type Bearish reversal Preference The price is rising towards the pivot at 0.7107, a pullbac
VWAP Swing Strategy Update 13/2/26In this update, we review the latest alerts and current positions for the VWAP swing strategy. To review today's video analysis, click here!...
VWAP Swing Strategy Update 13/2/26In this update, we review the latest alerts and current positions for the VWAP swing strategy. To review today'
Title USOUSD M30 | Bullish bounce off pullback support Type Bullish bouncePreference The price is falling towards the pivot at 64.64, a pullback support slightly below the 50% Fibonacci retracement. A bounce from this level could lead the price toward the 1st resis...
Title USOUSD M30 | Bullish bounce off pullback support Type Bullish bouncePreference The price is falling towards the pivot at 64.64, a pullback suppo

