Institutional Insights: State Street 'Drivers In Favour of Gold'

Gold — Three Structural Drivers Still Support the Bull Case
Gold remains supported by a powerful combination of central bank accumulation, emerging market demand broadening, and debt / debasement / geopolitical risk. Even after a large move in price, the core bull case is not simply momentum-driven. It is increasingly structural, with official-sector, institutional, and retail demand channels all reinforcing gold’s role as a reserve asset, monetary hedge, and liquid diversifier.
The key point: central banks and APAC investors are raising the marginal clearing price of gold, while fiscal deterioration and geopolitical fragmentation continue to support strategic allocations.
1. Resilient Central Bank Buying
Central banks continue to buy bullion at scale. Demand accelerated to 244 tonnes in 1Q26, even with tactical sales from Turkey and Russia. Importantly, those sales should not necessarily be interpreted as weakening the official-sector trend. Instead, they may reinforce one of gold’s most important features: it is a reserve asset that can be mobilized during periods of geopolitical stress, liquidity pressure, or balance-of-payments need.
That reserve utility is incrementally bullish over time. The fact that certain central banks can sell gold tactically in stress periods highlights why other central banks want to own it strategically.
We expect continued accumulation from central banks in 2026, marking the 17th consecutive year of net purchases since the Global Financial Crisis. That matters because official-sector buying tends to be:
Policy-driven
Long-horizon
Less sensitive to short-term price changes
Less reactive than ETF or speculative flows
More strategic than tactical
This creates a durable floor under gold. Central banks are not usually buying gold for a quick trade; they are buying it for reserve diversification, sanctions resilience, currency hedging, and long-term balance-sheet insurance.
Central Banks Are Raising the Clearing Price
A key implication is that central banks are effectively raising the marginal clearing price of gold over time. Their steady demand helps damp downside volatility during periods when investors liquidate via ETFs or futures. This is one reason gold has been able to remain underpinned in the US$4,000–5,000/oz zone.
Another important nuance: while central banks’ percentage share of total demand may decline as other demand channels expand, the US dollar value of central bank purchases continues to trend higher. In other words, official-sector demand is still becoming more important in nominal value terms, even if its share of the total pie fluctuates.
2. Emerging Market Demand Is Becoming More Structural
The second major support is emerging market demand, especially in APAC. Regulatory and market initiatives are broadening participation across retail, institutional, and official sectors, creating structural demand channels that sit alongside traditional macro tailwinds.
YTD, APAC-domiciled gold ETF inflows have reached US$16.2bn, equal to roughly 100 tonnes, accounting for 82% of global gold ETF net inflows. That is an extraordinary concentration of demand and suggests APAC is increasingly the marginal buyer in the ETF market.
China and Hong Kong
China remains central to this story. The insurer pilot allowing up to a 1% allocation to gold supports institutional adoption and may have room to expand over time. Even small allocation shifts matter given the size of China’s insurance and institutional asset base.
Chinese and Hong Kong-domiciled gold ETFs have attracted US$9.7bn, or 58 tonnes, YTD. That accounts for 49% of global net inflows. This is not just retail enthusiasm; it reflects a broader institutionalization of gold allocation in the region.
Drivers include:
Reserve diversification
RMB volatility concerns
Property-market weakness
Lower confidence in traditional domestic stores of value
Institutional product development
Policy-enabled allocation channels
Japan
Japan is also becoming more important. The macro backdrop is supportive for gold: low real rates, fiscal concerns, and currency weakness. The Bank of Japan has revised FY2026 growth down to 0.5% from 1.0%, while projecting core CPI at 2.5–2.7%. That is a stagflationary backdrop: weak growth but persistent inflation.
Such an environment is typically negative for cash and bonds but supportive for gold. If nominal yields stay contained while inflation remains sticky, real returns on traditional fixed-income assets remain unattractive. Gold benefits as a non-yielding asset when the alternative is negative or low real yield.
Tax incentives are also broadening participation across retail and asset managers. Institutional allocations remain low or near zero, which leaves significant upside potential if gold becomes a more accepted portfolio diversifier.
Rising awareness is accelerating adoption of gold ETFs and investment trust management funds as preferred vehicles. Combined Japanese inflows have reached US$6.5bn, or 35 tonnes, YTD.
3. Debt, Debasement, and Geopolitical Risk
The third pillar is the macro reserve-hedge argument: ballooning fiscal deficits, rising global debt, policy uncertainty, geopolitical fragmentation, and long-term currency debasement concerns.
Global debt reached a record US$353tn in 1H26, with government debt approaching one-third of that total, also an all-time high. This matters because rising sovereign debt creates several gold-supportive conditions:
Elevated inflation expectations
Currency debasement concerns
Fiscal dominance risk
Debt-trap fears
Higher term-premium volatility
Greater demand for non-sovereign monetary assets
An active fiscal and inflation impulse should continue to support gold as both a monetary hedge and a strategic reserve asset. Investors are increasingly looking for assets that are liquid, globally accepted, politically neutral, and not someone else’s liability. Gold fits that role uniquely.
Geopolitical Fragmentation Supports Allocation
Unresolved trade and tariff tensions, policy uncertainty, and a fragmented geopolitical backdrop all reinforce the case for gold. The same is true for ongoing reserve reallocation, especially among central banks looking to diversify away from excessive USD exposure or reduce vulnerability to sanctions architecture.
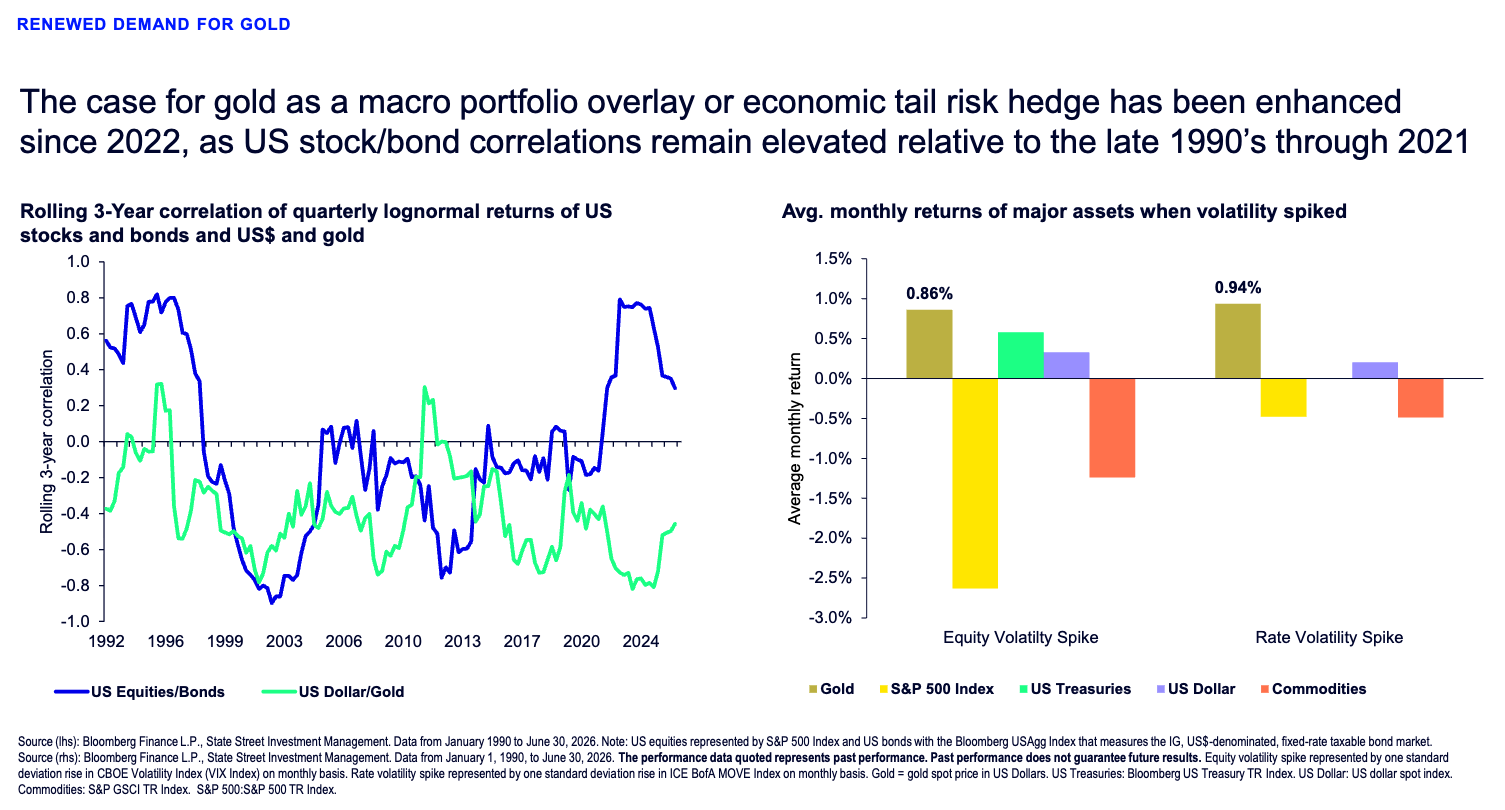
Gold also benefits from elevated stock/bond correlations. When bonds fail to hedge equities because inflation is the common shock, investors need alternative diversifiers. Gold’s role improves in portfolios where the traditional 60/40 hedge relationship is less reliable.
Positioning Still Has Room
Record gold ETF inflows in 2025 helped rebuild investor positioning, but 2026 flows have been uneven. Importantly, global gold fund ownership remains below 1% of worldwide mutual fund and ETF assets, well below common 3–10% strategic allocation targets.
That means positioning is not necessarily maxed out. If macro conditions stabilize or if fiscal / geopolitical risks remain elevated, there is room for allocations to recover further. Even modest rebalancing toward strategic target weights could represent a meaningful demand impulse.
Investment Implications
Gold’s bull case is increasingly structural rather than purely cyclical. The key supports are:
Driver | Why It Matters |
|---|---|
Central bank buying | Long-horizon demand, less price-sensitive, creates durable floor |
APAC ETF / institutional demand | Broadening structural participation, especially China / Japan |
Debt and deficits | Supports debasement hedge and reserve asset demand |
Geopolitical risk | Increases demand for neutral, liquid reserves |
High stock/bond correlation | Makes gold more valuable as a diversifier |
Low global fund ownership | Leaves room for allocation growth |
The practical takeaway is that dips are likely to be bought by official and emerging-market demand channels, especially if real yields remain contained or geopolitical risks stay elevated.
Gold remains well supported by three durable drivers: central bank accumulation, emerging market demand, and debt / debasement / geopolitical risk. Central banks are on track for a 17th consecutive year of net buying, APAC has accounted for 82% of global gold ETF inflows YTD, and record global debt of US$353tn continues to reinforce gold’s role as a monetary hedge.
The official sector is raising the marginal clearing price of gold, while APAC investors are broadening the demand base and fiscal/geopolitical risks are strengthening the strategic allocation case. With global gold fund ownership still below 1% of worldwide MF/ETF assets versus 3–10% strategic targets, positioning still has room to expand.
The result is a durable bull-market framework: gold may consolidate tactically, but structurally the floor is rising.
Gold Scenarios — Bull Cycle Intact, but the Ride Gets Bumpier
The gold framework remains structurally bullish, but with a more tactical two-way setup than the 2024–2025 phase. The base case is not a vertical melt-up; it is a consolidation-and-grind-higher regime where structural demand continues to support the market, but higher real yields, a firmer dollar, and a Fed on hold for longer create intermittent headwinds.
The scenario-weighted view still favors higher gold into early 2027, with the core trading range centered around US$4,750–5,500/oz. The downside case is meaningful but likely contained by official-sector and APAC demand, while the upside tail requires a cleaner macro impulse: dovish Fed pivot, weaker USD, lower real yields, or a volatility/liquidity shock.
Scenario Framework
Scenario | Probability | Gold Range | Core Macro Setup |
|---|---|---|---|
Base Case | 70% | US$4,750–5,500/oz | Consolidation, grind higher, Fed restrictive for longer, structural demand intact |
Bull Case | 5% | US$5,500–6,250/oz | Dovish Fed pivot, weaker USD, falling real yields, risk/liquidity shock |
Bear Case | 25% | US$4,000–4,750/oz | Stronger USD, higher real yields, improved US growth, less supportive Fed |
The probability distribution is important. This is not a high-conviction call for an immediate upside breakout above US$6,000/oz. The most likely path is choppy appreciation, with dips supported by structural buyers and rallies periodically capped by macro headwinds.
Base Case — 70% Probability: US$4,750–5,500/oz
The base case projects gold consolidating and grinding higher into early 2027, trading in a US$4,750–5,500/oz range. This scenario assumes the broader bull market remains intact, but tactical headwinds prevent a straight-line move higher.
Tactical Headwinds
Gold faces several near-term pressures:
Higher opportunity costs
Rising real yields
Firmer US dollar
Fed potentially on hold for longer
Rates traders pricing out earlier cut expectations
ETF redemptions
Denomination effects from USD strength
Spot bullion’s recent pullback and ETF outflows suggest tactical bearish pressure has increased. However, these pressures are not strong enough to break the broader structural bull-market framework.
Why the Bull Cycle Still Has Legs
The base case rests on durable demand supports:
Global debt loads remain elevated.
Stock/bond correlations remain high.
EM central banks continue accumulating.
China retail demand remains resilient.
APAC ETF participation is broadening.
Global gold fund ownership remains below 1% of worldwide mutual fund and ETF assets.
Gold continues to function as a monetary hedge and liquid portfolio diversifier.
The key point is that financial ownership remains low relative to strategic allocation targets. Even after record inflows in 2025, gold is not broadly over-owned across global portfolios. That leaves room for strategic allocations to continue recovering over time.
Base Case Interpretation
This is a buy-dips / sell-rips environment within an upward-sloping range. Gold can be pressured when real yields rise or the USD rallies, but structural buyers should support pullbacks. The bull trend continues, but at a slower and more volatile pace than in 2024–2025.
Bull Case — 5% Probability: US$5,500–6,250/oz
The bull case is less likely than it appeared in the January / February macro environment, but it remains viable. Gold can still move into the US$5,500–6,250/oz range if the macro backdrop turns meaningfully more supportive.
What Would Put US$6,000 Gold Back in Play?
A move above US$6,000/oz likely requires at least one of the following:
Significant dovish Fed pivot
Renewed USD downtrend
Declining real yields
Volatility or liquidity shock in risk assets
US stagflation fears
Acceleration in reserve reallocation
Strong ETF inflow recovery
In this scenario, central bank and China retail demand remain steady, but the incremental catalyst comes from financial investors returning more aggressively. ETF flows would need to recover meaningfully, and macro would need to become less hostile.
Why the Upside Tail Remains Valid
The structural themes are still powerful:
Global alt-fiat demand
Currency debasement concerns
US fiscal debt / deficit widening
Reserve diversification
Sanctions / geopolitical reserve risk
Physical demand resilience despite record prices
If the USD resumes a downtrend or markets begin to fear US stagflation, gold could accelerate higher quickly. A stagflation narrative is especially bullish because it combines weak growth with sticky inflation — undermining both cash and bonds while supporting monetary hedges.
Bull Case Interpretation
The bull case is an upside tail, not the central expectation. Gold above US$6,000/oz remains possible, but it likely needs a more decisive macro catalyst than the market currently has.
Bear Case — 25% Probability: US$4,000–4,750/oz
The bear case assumes the macro backdrop becomes more difficult for gold. Further USD strength, higher real yields, improved US growth, and a less supportive Fed reaction function could push gold down into the US$4,000–4,750/oz range.
Main Downside Risks
The clearest tactical risks are:
Higher real rates
Stronger USD
Markets pricing out cuts
Markets pricing in a tighter Fed path
Improved US growth reducing hedge demand
ETF redemptions extending
Record prices discouraging APAC physical demand
If the US economy improves while inflation remains manageable, the market may reduce demand for gold as a defensive monetary hedge. A stronger dollar also weighs mechanically through denomination effects, especially for non-USD buyers.
Why Downside Should Be Supported
Even in the bear case, structural problems do not disappear. US and global debt loads remain unresolved, fiscal deficits persist, and reserve diversification remains relevant. Chinese investors and central banks are also expected to remain net buyers.
That should limit downside versus prior cycles. The key support zone is around US$3,750–4,000/oz, with the US$4,000–4,100/oz area likely to attract renewed interest.
The text also notes that record-high prices could hinder APAC physical demand, but there is not yet meaningful aggregate evidence of demand destruction. Importantly, there appears to be plenty of cash on the sidelines ready to buy dips.
Bear Case Interpretation
The bear case is a tactical correction within a structural bull market, not a regime reversal. Gold can trade lower if real yields and the USD rise, but official-sector and EM demand should provide support around US$4,000/oz.
Scenario-Weighted Range
Using the midpoint of each scenario:
Scenario | Probability | Range | Midpoint | Weighted Contribution |
|---|---|---|---|---|
Base | 70% | 4,750–5,500 | 5,125 | 3,587.5 |
Bull | 5% | 5,500–6,250 | 5,875 | 293.8 |
Bear | 25% | 4,000–4,750 | 4,375 | 1,093.8 |
The probability-weighted midpoint is:
3,587.5+293.8+1,093.8=4,975.13,587.5+293.8+1,093.8=4,975.1
So the scenario-weighted gold level is approximately:
US$4,975/ozUS$4,975/oz
This aligns with the base-case view: gold should consolidate and grind higher, but the market is not pricing or assigning high probability to an immediate move well above US$6,000/oz.
Key Levels
Gold Level | Significance |
|---|---|
US$6,250/oz | Upper end of bull case |
US$6,000/oz | Major upside psychological / macro tail level |
US$5,500/oz | Base-case upper bound / bull-case lower bound |
US$4,975/oz | Scenario-weighted midpoint |
US$4,750/oz | Base-case lower bound / bear-case upper bound |
US$4,100/oz | Likely renewed demand zone |
US$4,000/oz | Major structural support |
US$3,750/oz | Robust downside support zone |
Trading Implications
Preferred Strategy: Buy Dips, Avoid Chasing Vertical Rallies
Given the probability distribution, the best framework is to accumulate on weakness rather than chase upside breakouts.
Buy pullbacks toward US$4,100–4,750/oz
Expect structural support near US$4,000/oz
Take profit / reduce tactical longs into US$5,500/oz
Reassess upside optionality above US$5,500/oz
What to Watch
The gold range will be governed by five core variables:
Real yields — the clearest tactical driver.
US dollar — stronger USD pressures gold; weaker USD unlocks upside.
Fed reaction function — restrictive-for-longer caps rallies; dovish pivot reopens US$6,000+.
ETF flows — needed for bull-case acceleration.
Central bank / APAC demand — core downside support.
Best Expressions
Depending on risk appetite:
Physical / ETF accumulation on dips for strategic exposure.
Call spreads targeting US$5,500–6,000/oz if looking for upside tail.
Put spreads or collars if concerned about a USD / real-yield squeeze.
Relative allocation vs. bonds for investors worried about stock/bond correlation and fiscal risk.
Disclaimer: The material provided is for information purposes only and should not be considered as investment advice. The views, information, or opinions expressed in the text belong solely to the author, and not to the author’s employer, organization, committee or other group or individual or company.
Past performance is not indicative of future results.
High Risk Warning: CFDs are complex instruments and come with a high risk of losing money rapidly due to leverage. 69% and 73% of retail investor accounts lose money when trading CFDs with Tickmill UK Ltd and Tickmill Europe Ltd respectively. You should consider whether you understand how CFDs work and whether you can afford to take the high risk of losing your money.
Futures and Options: Trading futures and options on margin carries a high degree of risk and may result in losses exceeding your initial investment. These products are not suitable for all investors. Ensure you fully understand the risks and take appropriate care to manage your risk.
Patrick has been involved in the financial markets for well over a decade as a self-educated professional trader and money manager. Flitting between the roles of market commentator, analyst and mentor, Patrick has improved the technical skills and psychological stance of literally hundreds of traders – coaching them to become savvy market operators!